Reports of WP2: Project Coordination and Management
Picture: Canary Island Report 2.1: Data Management Plan. D2.1 (Confidential) Report 2.2: General assembly and steering committee meetings plan. D2.2 (Confidential) Report 2.3: Synergies and Networking Reports with annexes. D2.3 Report 2.4: Management Report. D2.4...
Reports of WP3: Climate Change vulnerability assessment and impact chains
Picture: Corsica (France) Report 3.1: Blue Economy: boundaries, and statistical codes. D3.1 Report 3.2: Report on impact chains, with annexes per island and per sector. D3.2 Report 3.3: Report on selected indicators. D3.3 Report 3.4:Report on modelling chains....
Reports of WP4: Modelling climate impacts in 11 EU islands´ case studies for 2030-2100
Picture: Cyprus Report 4.1: Report on existing simulations and observations, and on the derived impact indicators and indices. D4.1 Report 4.2: High resolution wave and sea level climatology atlas. D4.2 Report 4.3: Atlases of newly developed hazard indexes and...
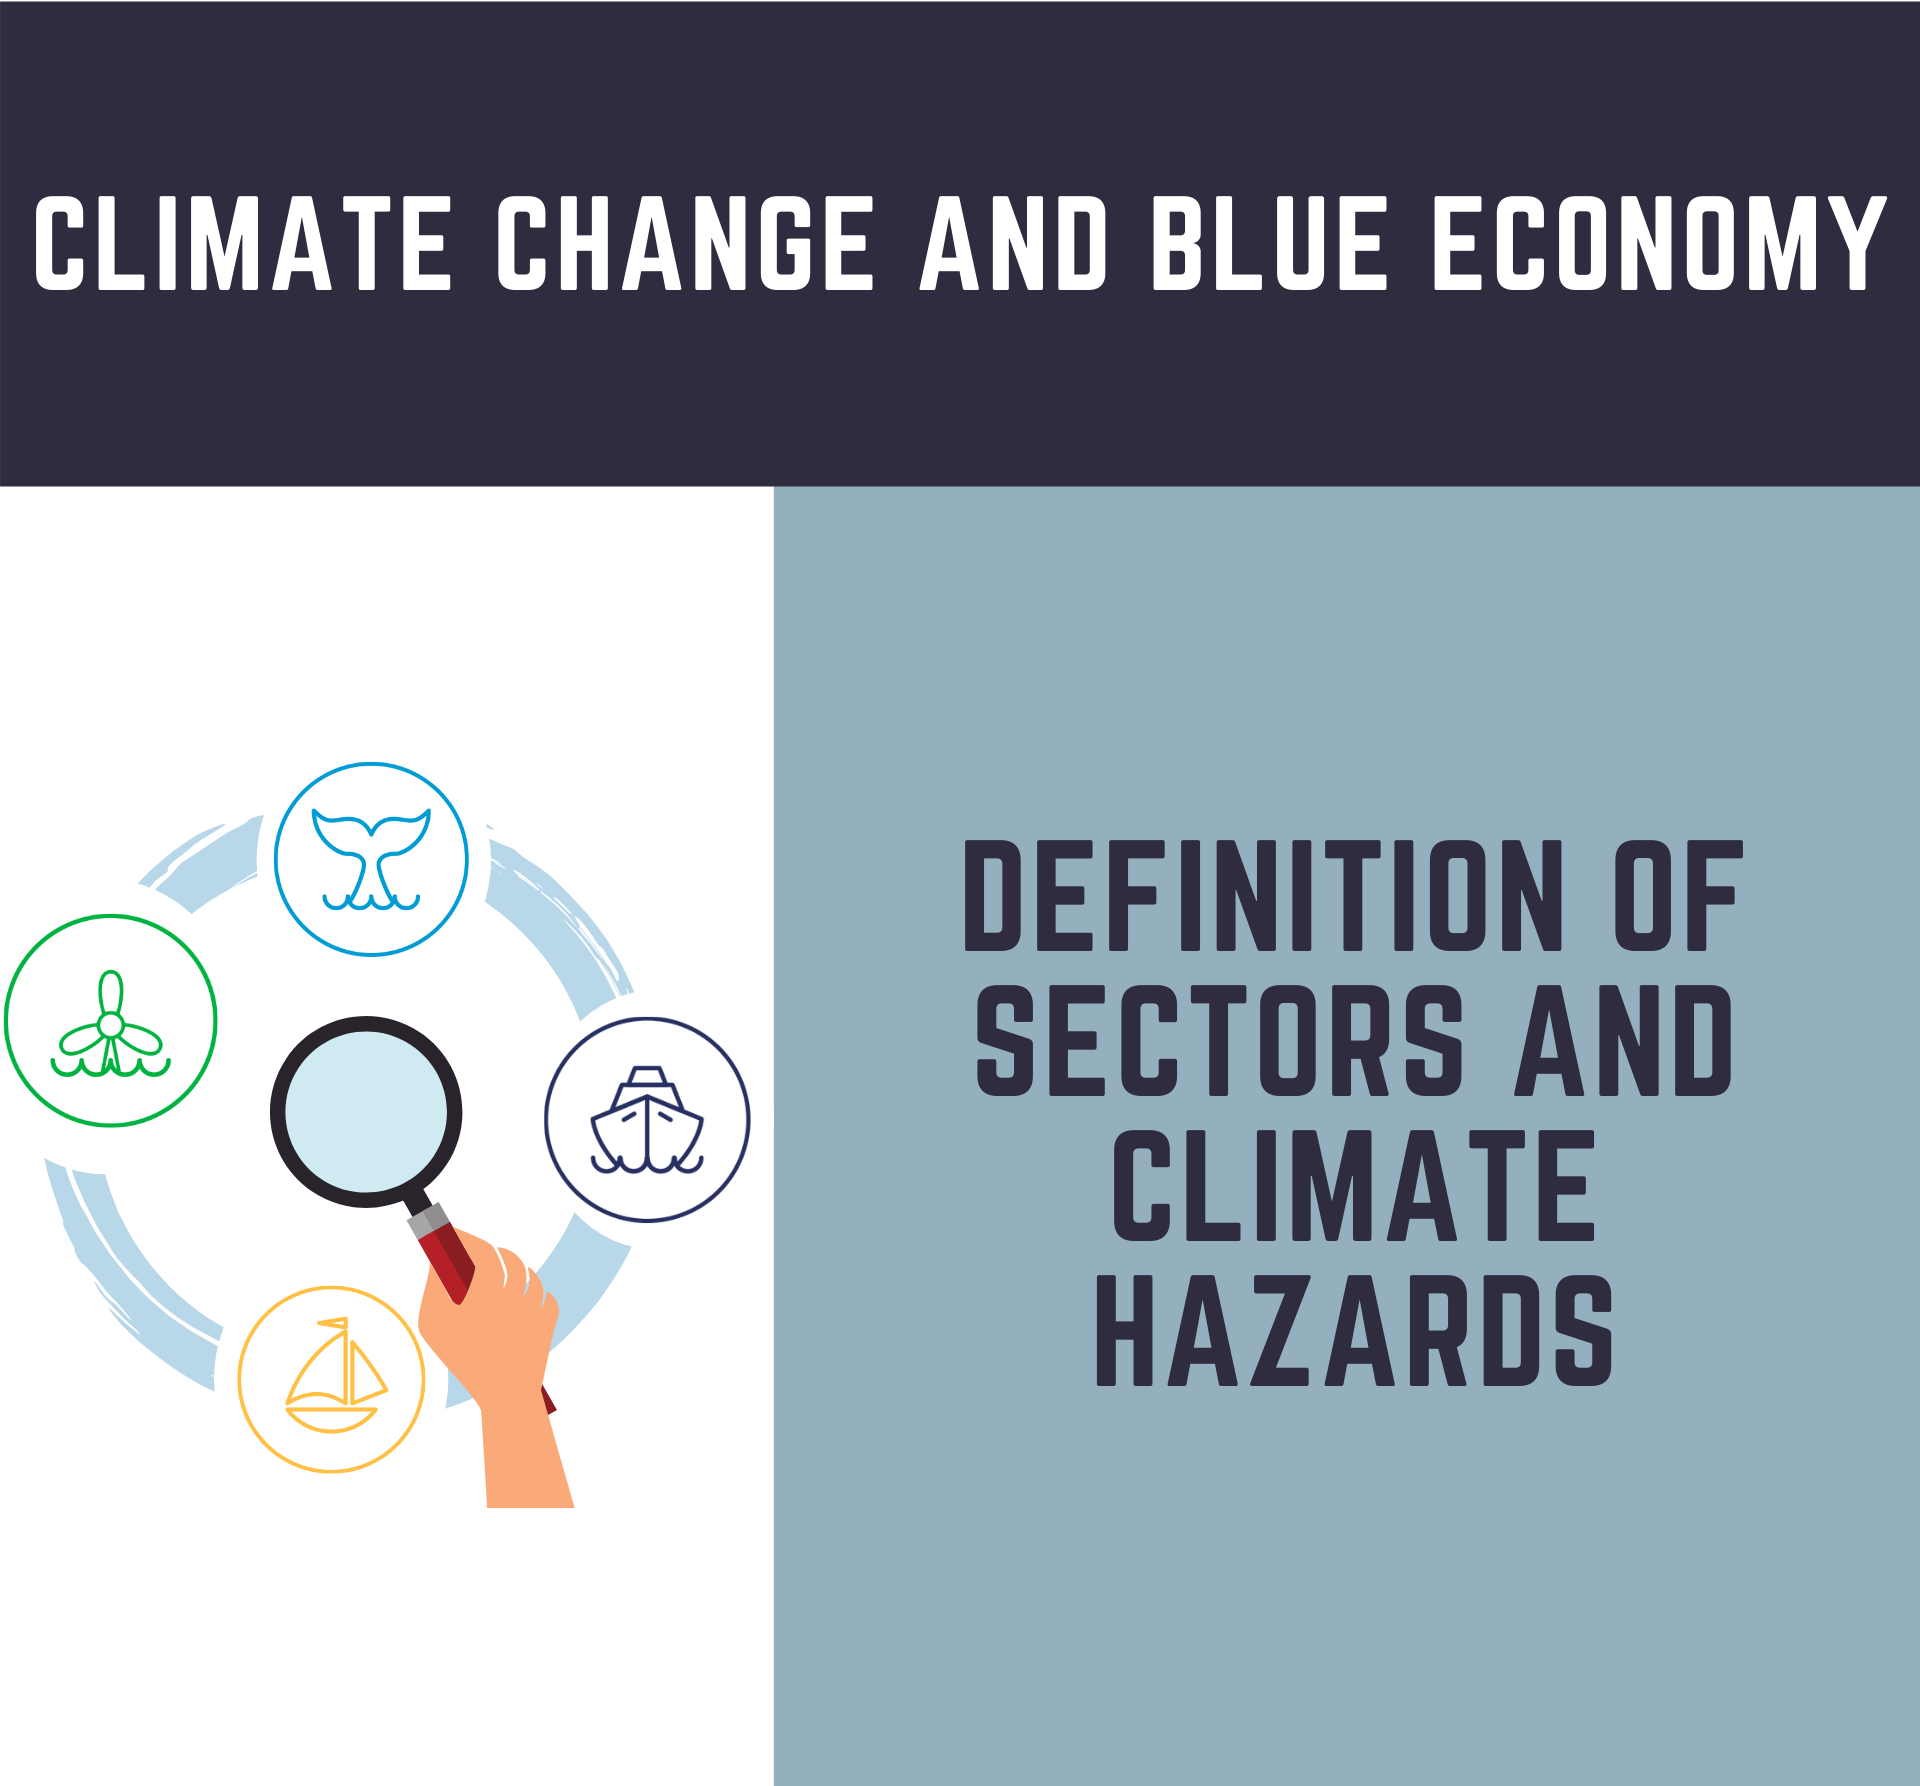
Definition of sectors and climate hazards
Click on the image to go to the dynamic presentation READ MORE: D 3.1. Validated Matrix on Blue Economy sectors lead, boundaries and statistical codes, per island focal...
From climate hazards to complex impact chains
READ MORE: Report 3.2: Report on impact chains, with annexes per island and per sectorD 3.1. Validated Matrix on Blue Economy sectors lead, boundaries and statistical codes, per island focal...
Climate Change outlook: projected changes on hazard indicators until 2100
Note: It is important to note that Atlantic islands (Azores, Madeira, Canaries and West Indies) lie in very critical areas and regional models are not available. Although local resolution has been significantly...